

Ads Attribution
What this feature helps you understand
Ads tracking lets you compare what the ad platform reports against what Thunder actually detects as the real result of your campaigns.
Use this feature to understand which campaigns, ad sets, and ads are truly driving purchases and product demand.
How to read the data
Ads tracking gives you an Ads Manager-style view of your ad performance. You can switch between three levels:

- Campaigns
- Ad sets/Ad groups
- Ads
Start with a high-level view of your campaigns, then go deeper into specific ad sets or individual ads.
The table is divided into two main parts: ad platform data and Thunder data.
Ad platform data
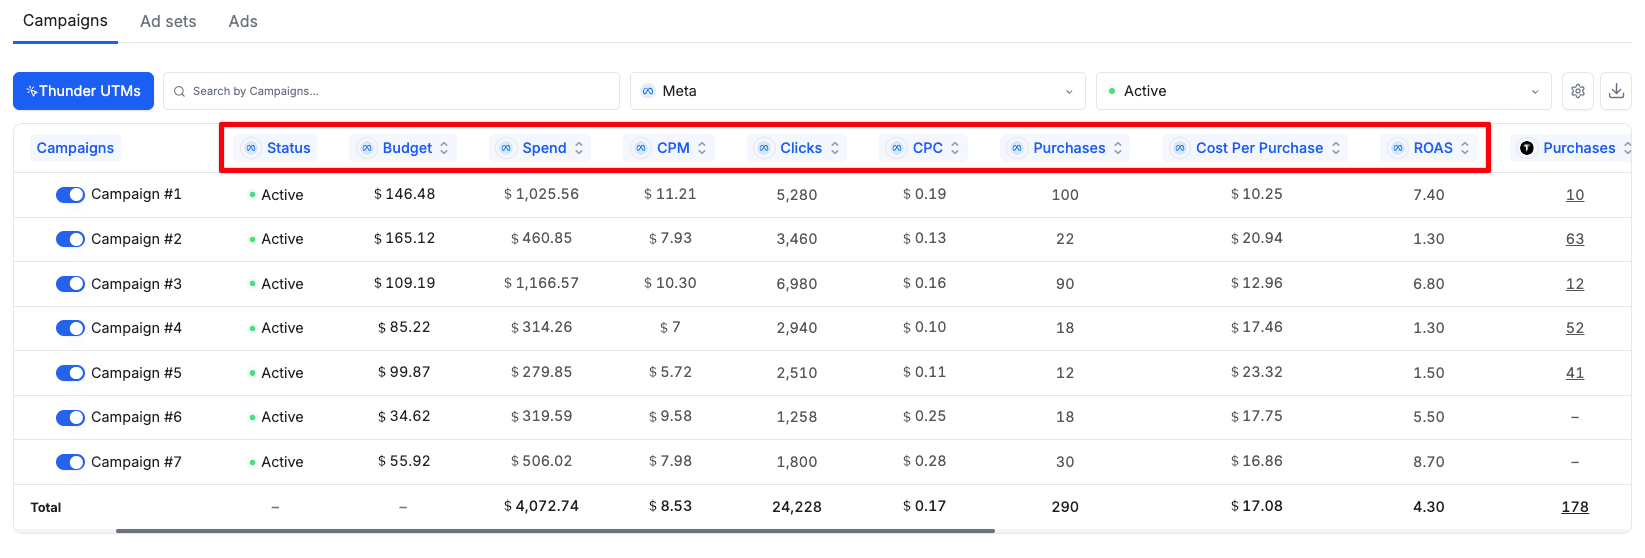
Ad platform data shows the metrics reported by the ad platform. These are the same metrics you would normally see inside Meta, TikTok, Snapchat, or Google Ads Manager. Thunder does not edit or change these numbers. They are shown so you can compare the platform's data against Thunder's data.
Ad platform data includes:
| Metric | Description |
|---|---|
| Status | The current status of the campaign, ad set, or ad |
| Budget | The planned spending amount |
| Spend | The actual amount spent so far |
| CPM | The cost to reach 1,000 ad impressions |
| Clicks | The total number of times ads were clicked |
| CPC | The average cost per ad click |
| Sales | Purchases reported by the ad platform |
| Cost per sale | The average cost per purchase reported by the ad platform |
| ROAS | The revenue earned for every dollar spent on advertising, reported by the ad platform |
Thunder data
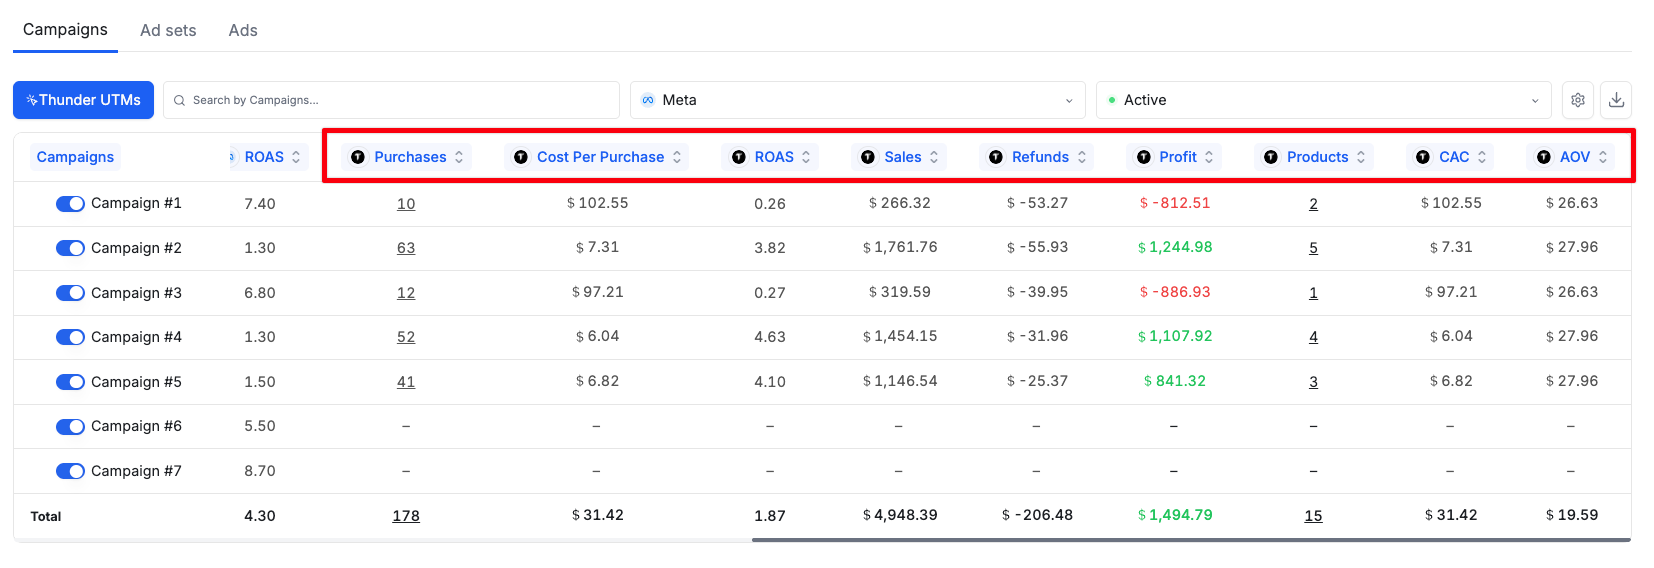
This is the main value of Ads tracking. Thunder data shows you the real performance of your campaigns, ad sets, and ads, including metrics that are either not reported accurately or not available inside your Ads Manager.
Thunder data includes:
| Metric | Description |
|---|---|
| Purchases | The actual number of purchases tracked by Thunder |
| Cost Per Purchase | The average cost per purchase |
| ROAS | The revenue earned for every dollar spent on advertising |
| Sales | The total revenue generated |
| Refunds | The total amount refunded to customers |
| Profit | Profit = sales - refunds - ad spend |
| Products | The number of unique products purchased |
| CAC | The average cost to acquire a new customer |
| AOV | The average amount spent per purchase |
How to make decisions based on this data
When you compare ad platform data with Thunder data, you should expect the numbers to be different. That difference falls into one of two situations:
Over-attribution
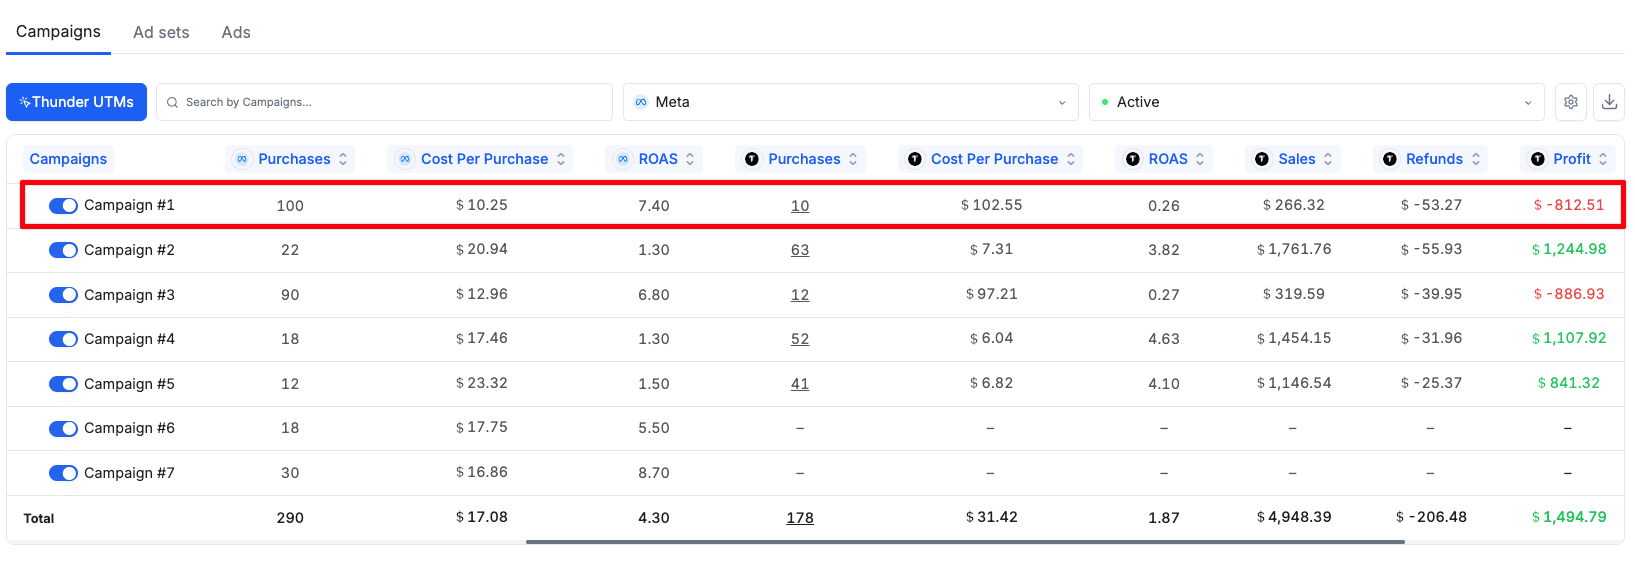
In this example, Meta reports 100 purchases, while Thunder detects only 10.
Meta is giving the campaign more credit than it earned. The campaign looks profitable inside Meta Ads Manager, but Thunder shows the real result is far lower. If you rely on Meta's numbers alone, you keep spending on a campaign that is losing money.
Recommended action: Evaluate the campaign using Thunder data. If it does not perform within your target over a 4 to 7 day window, turn it off.
Under-attribution
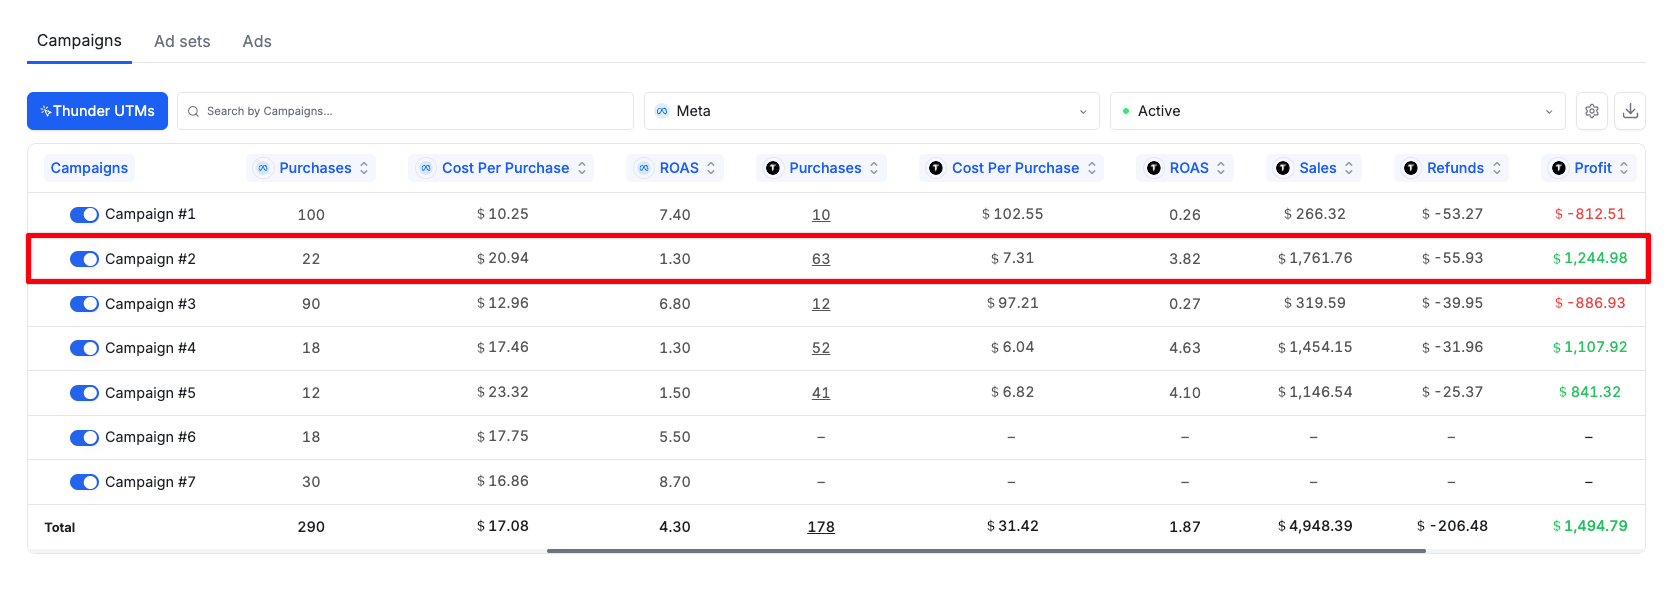
In the example above, Meta reports 22 purchases, while Thunder detects 63 from the same campaign.
Meta is giving the campaign less credit than it earned. The campaign looks weak inside Meta Ads Manager, but Thunder shows it is driving far more results than the platform reports. If you rely on Meta's numbers alone, you risk pausing or cutting a campaign that is actually working.
Recommended action: Evaluate the campaign using Thunder data. If it performs within your target over a 4 to 7 day window, keep it running, and consider increasing spend.